
Let’s take a dive into the world of scientific and technical data display and see how we can make the communication of large datasets more understandable for both technical and non-technical audiences.
Scientists are trained from the start about the power of large datasets. Generally, the more data you have, the more confidence you have in your understanding of whatever it is you are studying. Perhaps it is no surprise that most scientists feel the need to honor that data when presenting their research. We’ve all seen the presentations where the researcher displays a plot with a million data points and proudly refers to it as supporting their thesis. This plot serves two purposes. The obvious one is that it displays some trend or relationship that is critical to supporting the researcher’s findings. Secondly, by showing all of that data, the researcher is validating their work by verifying that, yes, a lot of data were collected and/or analyzed and therefore the audience should have faith in their results.
This second point is unquestionably very important when presenting research to technical audiences. Your peers want to know your conclusions about your data but they also want to see the data themselves and verify your interpretation and, as stated above, be confident that enough data was analyzed for your results to be significant. This verification by peers is a critical part of the scientific process and will always be a part of communicating with technical audiences.
The problem arises when the researcher uses the same approach when communicating with the general public. While they might be impressed by the amount of data analyzed, they don’t necessarily want to verify your results by seeing all of it. If you are explaining a complex topic to a lay audience, complex graphs and figures will hinder not help your efforts. A better approach is to simplify graphs and graphics to show the trends and relationships and leave out the plots of every single data point you analyzed.
This idea may seem a bit unnerving to your average researcher- “I need to support my arguments with the data! Otherwise, how can the audience believe what I’m saying?” In actuality, if you are in the position of presenting your research to a general audience, your credentials have already been established and you are the accepted expert in the room. They assume that your methods are sound and are more interested in what you found and why it is important.
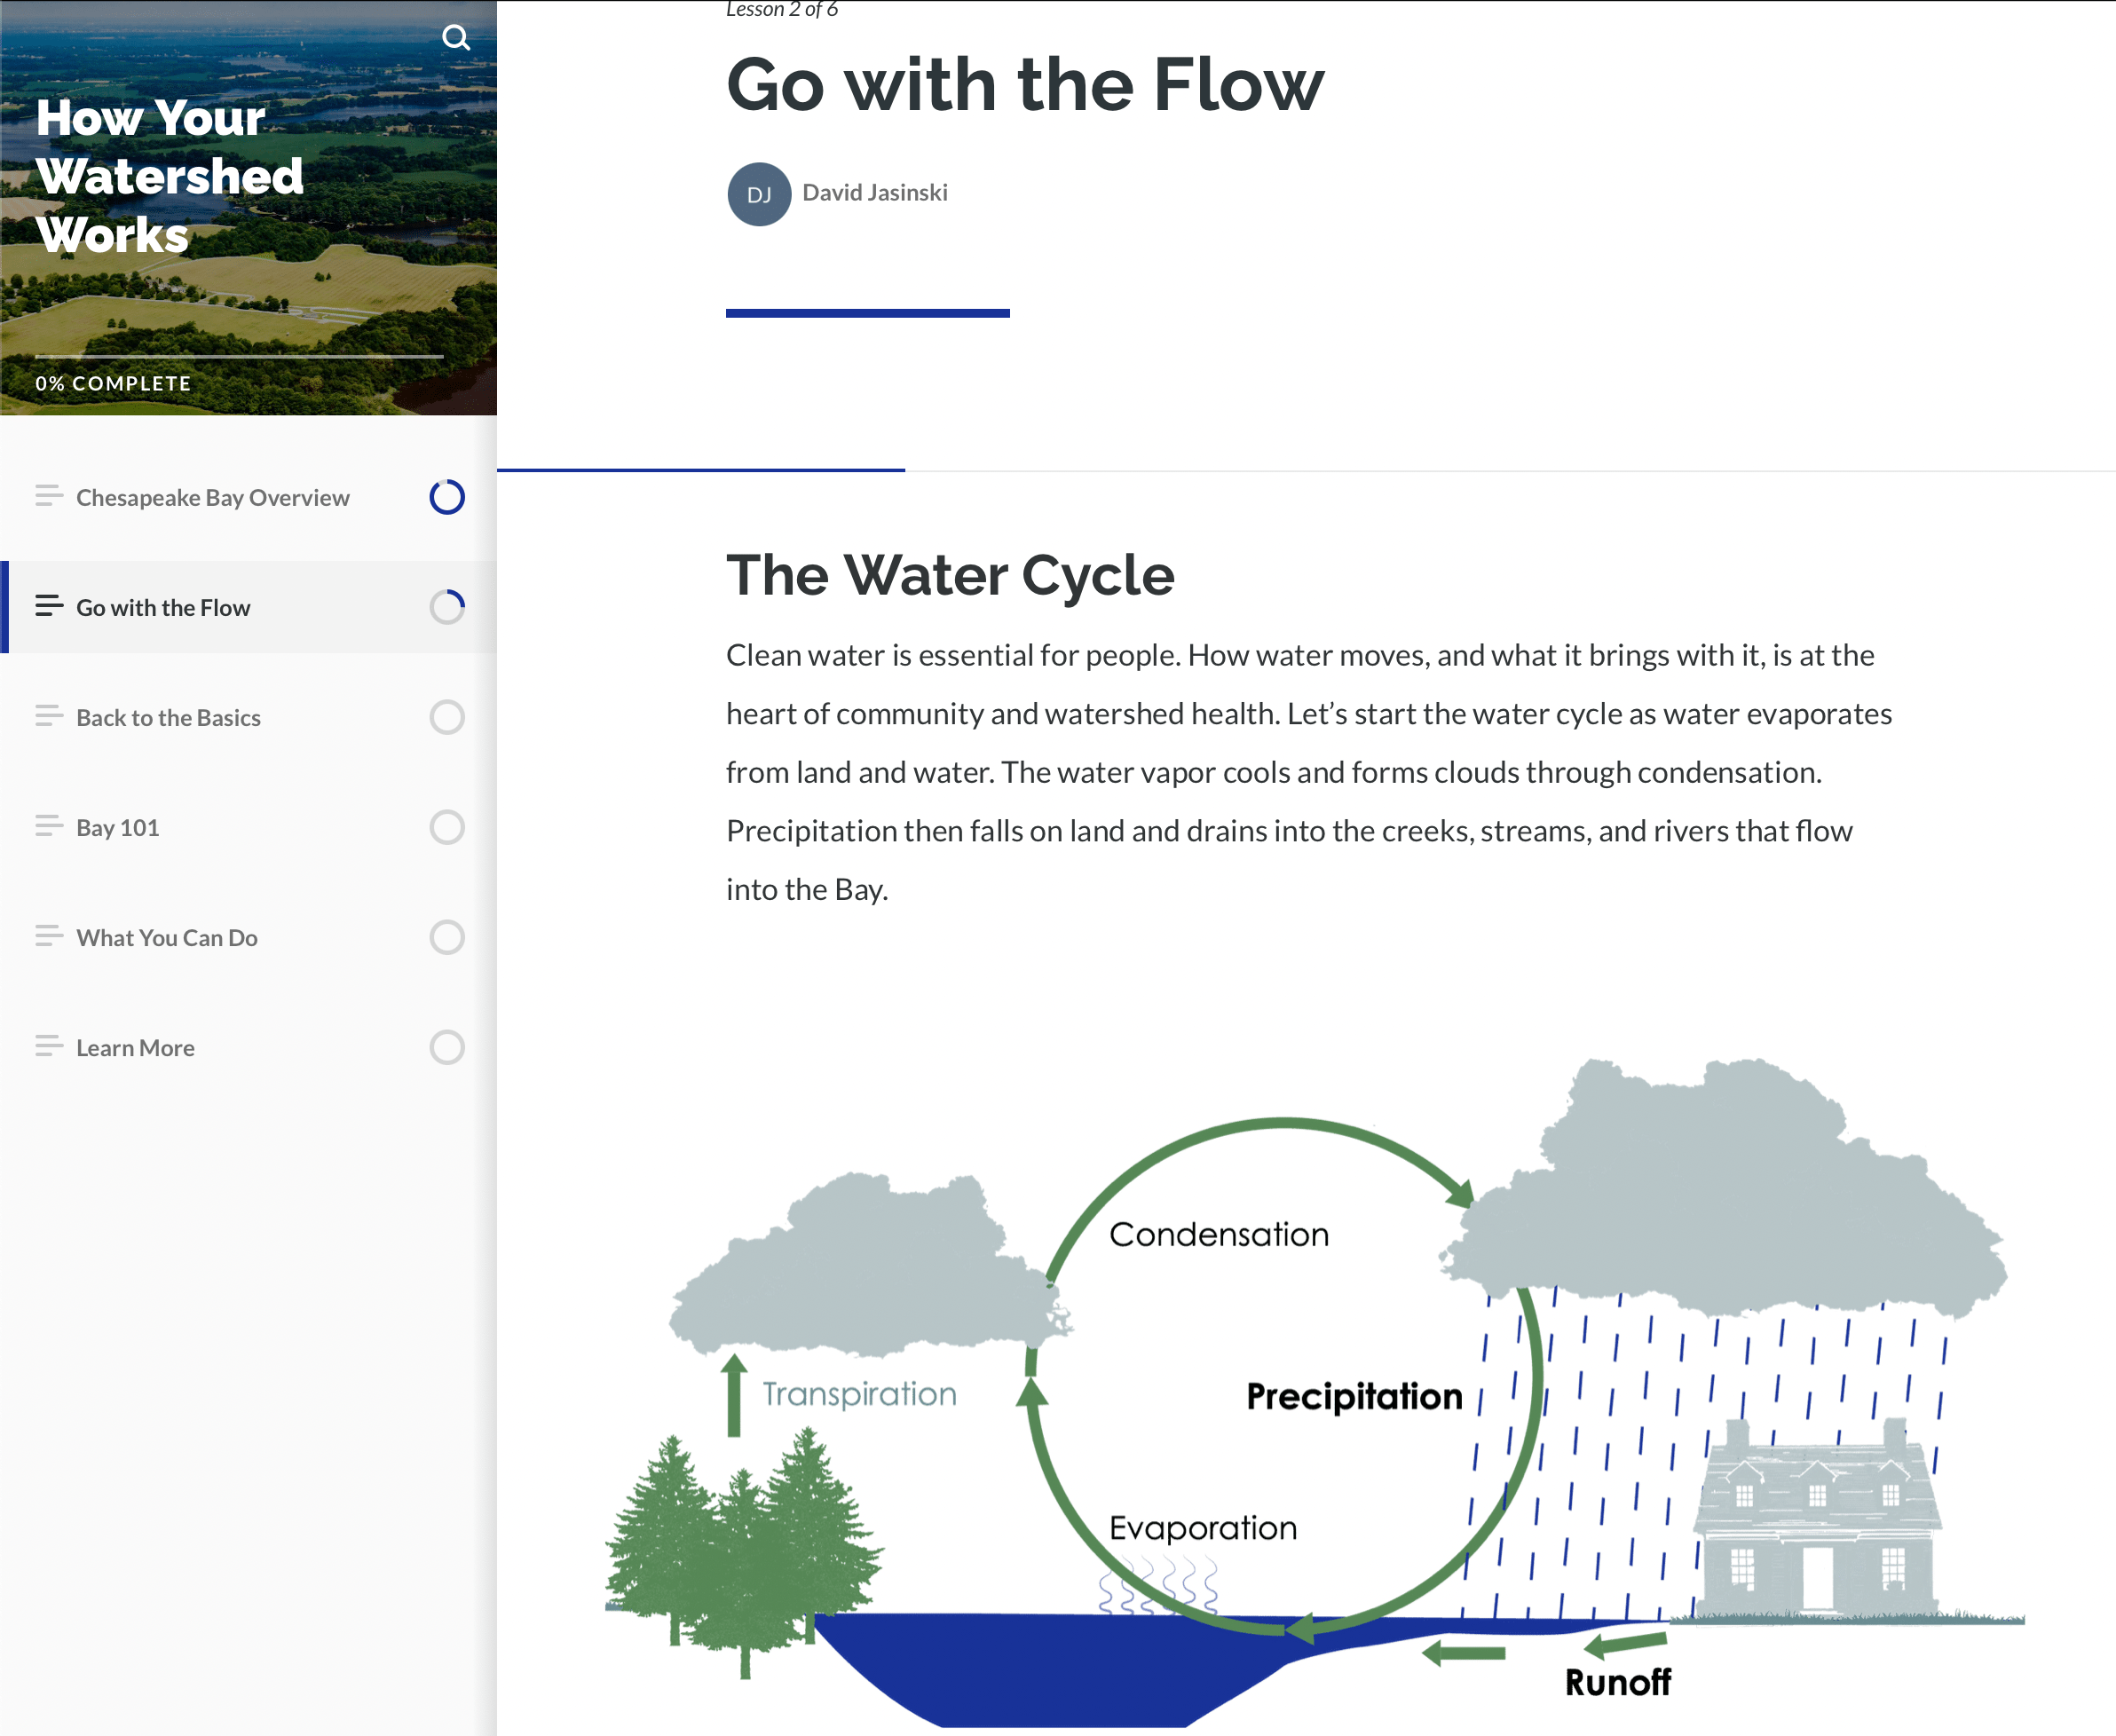
A couple years ago, we worked on a project with scientists from the University of Maryland where we examined 110 years of climate data from weather stations located around the Chesapeake region. Obviously, 110 years of daily observations from multiple stations amounts to a lot of data. This was a multifaceted project where we were not only analyzing the data but also communicating our findings in real time via a blog and social media as well as developing communication products and narratives for the Chesapeake National Estuarine Research Reserves.
The data were analyzed to see if there had been any changes over time using climate indices such as growing season length or the annual number of frost days. Not surprisingly, there were significant changes in almost all the climate indices over time, indicating that the Chesapeake Bay was already experiencing impacts due to climate change. The graphs that were initially developed to communicate these findings were similar to the one below, which shows an increase in growing season length over time.
This graph shows plots of three different ways of analyzing the data as well as a smoother trend line for each that removes some of the noise in the information. Scientists who look at this plot will appreciate the amount of data that was analyzed and will likely have faith in the conclusion that growing season length has increased over time. Many researchers will make the mistake of trying to use a graph like this when presenting their research to non-scientists. Unfortunately an audience of this kind will likely need some guidance to understand what the graph shows. Why burn time and the attention span of your audience explaining the graph? The graph should be clean, simple, and self explanatory. That way, you can spend your time explaining to your audience what your findings mean to them, which is what they really want to know.
So, working with the researchers, we decided that the real story in the above graph was told by the smooth trend lines. And, since they were all telling the same story, why not just use one? This lead us to the graph below.
In this version, we’ve eliminated everything except a single trend line. This graph was created to be used on social media, thus the colorful background. However, so as not to distract the viewer from what the graph is portraying, the only other color is white. It is now clear that the length of the growing season in days has been increasing over time. Because the presenter does not have to spend time explaining how to interpret the graph, they are free to explain the implications of a longer growing season in the Chesapeake region.
To sum up:
- Large datasets are an important part of understanding the natural world but how you display that data depends on your audience. This is a key component of all science communication – Know your audience!
- When presenting your research to a non-technical audience, less is more. Keep the graphs simple while still staying true to the data. If you have to spend time explaining the graph, that’s less time you have to speak about the importance of your research.
- Once you have your simple and easy to understand graphs, make sure you take the time to explain how your findings are important to your audience. Unfortunately, a lot of researchers forget this part!


