

Lauren
Waffle charts are the hip, fresh cousin of the much-maligned pie chart, and I find myself incorporating them whenever I can. They can give context to large numbers or add visual interest to cumbersome datasets. For example, Athan Mavrantonis (@amavrantonis) posted a graphic on Twitter that illustrated the difference in perception of a percentage and the raw number when it comes to food insecurity:

The waffle chart works brilliantly here to illustrate how small one in one hundred seems, compared to the somewhat unfathomable 74 million individuals who are actually starving in the world.


Dave

I think this graphic is a fantastic example of how a well designed infographic can introduce an issue, communicate the scale of the problem, but also present some possible solutions. The use of simple graphics at the top communicate bite-sized pieces of information that introduce what methane is and why it is a problem. Then the combination of scaled arrows and icons convey the sources, sinks, and surplus of methane in the atmosphere in a visually appealing and easy to understand format. It also shows that all sources are not from human origin. And at the end we are given at least some indication that all is not lost and there are potential solutions to the problem.

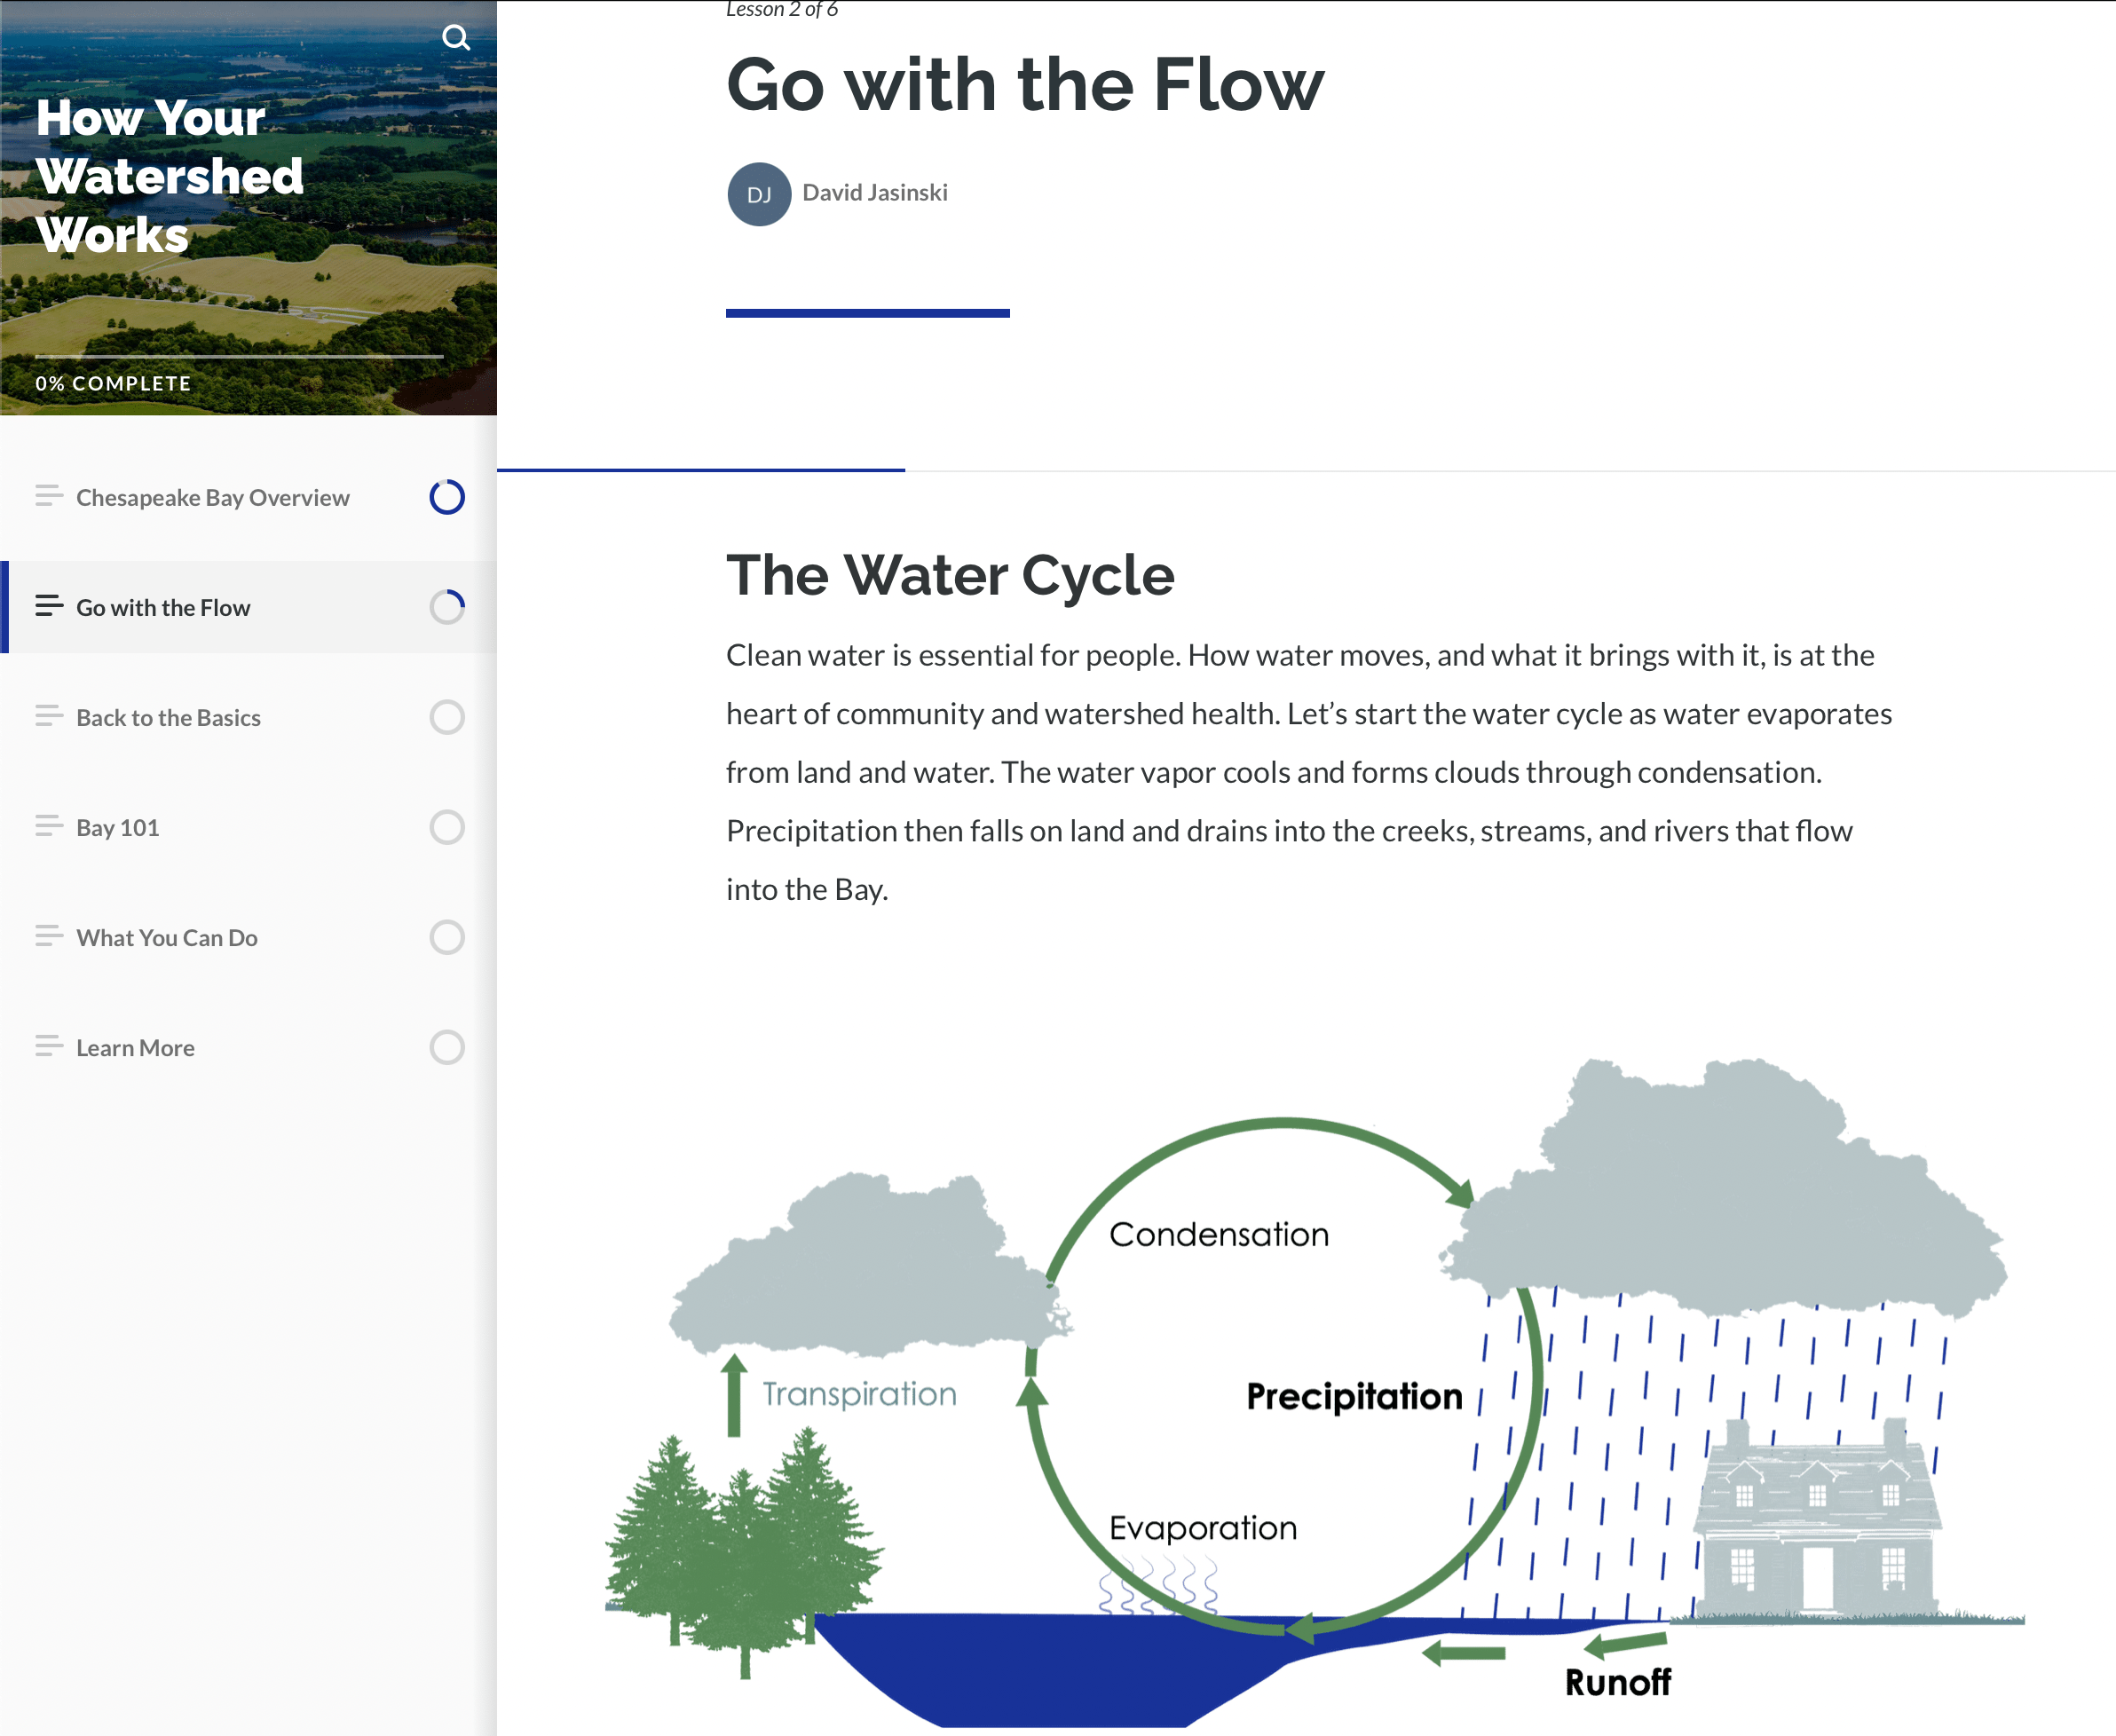
I was inspired by McCandless’s approach and decided to apply to an issue that is very near and dear to the folks that live around Chesapeake Bay (and all estuaries for that matter) – nutrient pollution. After all, imitation is the sincerest form of flattery!
Using numbers from the Chesapeake Bay Program, I created a graphic that explains nitrogen and phosphorus pollution and what the major contributors are in Chesapeake Bay. The graphic also explains how this pollution impacts the health of the Bay. I think that maybe my version is unfinished as, unlike McCandless, I don’t finish up with the potential solutions to nutrient pollution. I’ll keep working on it!
Shirley
Federica Fragapane is an Italian information designer who has visualized a multitude of topics from children’s books about Earth to carbon dioxide emissions. Her simple designs combine infographics and illustration, using elegant lines and colors to form eye-catching and informative visualizations.
One of my most recently discovered and favorite visualizations Fragapane created is called “The Shape of Dreams,” a visual exploration of Google searches for the interpretation of dreams. I came across this visualization as I was searching for the meaning to my own dreams (anyone else have a recurring nightmare of their teeth falling out?) and was comforted by the fact that I was not alone.

The Shape of Dreams website analyzes Google trend data for seven languages (English, Arabic, French, Japanese, Portuguese, Russian, and Spanish) from 2009–2019 and looks at it from four points of view, separated into four chapters. Each chapter first explains some insights and then delves into an interactive visualization that allows the reader to play with the data.

The visualization for data in Chapter 3: A Time for Dreams was the most simple, using a line chart to represent the interest over time for a single subject worldwide. However, I thought the results were particularly interesting where peaks in searches coincided with real-life events. For example, Dreaming about tsunami had a sharp peak in March 2011, which coincided with an earthquake and tsunami occurring in Japan at the same time.


